
Updated forecast for analytical instrumentation opportunities in North American cannabis market
Data taken from Top-Down Analytics (TDA) Research report: Cannabis 2020: North American market for analytical instrumentation
Top-Down Analytics (TDA) published an updated report detailing forecasts for analytical instrumentation adoption by the cannabis market, covering the current period 2019-2024, in April 2020. The new report incorporates four key subjects: overview of the cannabis market; end-user perspectives; market demand and vendor share analysis. Covering such a rapidly growing segment for analytical instrumentation sales, the report will be invaluable for suppliers wanting to know what testing is undertaken and the technologies used to carry out that testing on cannabis products, as well as the legal and regulatory structure of different states and federal legislation.
According to TDA, the legal cannabis market is growing at 25% CAGR, in turn causing the market for cannabis analysis to grow by almost 50% over the coming four years, expected to rise from $200m in 2019 to about $300m in 2024. This double-digit growth opportunity is uniquely open for instrument manufacturers, mostly in HPLC (high performance liquid chromatography) and LC/MS (liquid chromatography mass spectrometry), GC (gas chromatography) and GC/MS (gas chromatography mass spectrometry) and ICP-MS (inductively coupled plasma mass spectrometry). Based on historic data, TDA estimates that over $100m was spent on instrumentation for cannabis testing in 2019. In that year, more than half of labs spent on GC, HPLC and/or MS for testing of cannabis. In the short-term, plans to increase capacity and upgrade equipment mean that mass spec is edging ahead in terms of planned expenditure.
At the time of writing, most cannabis analysis is undertaken by laboratories that specialize in environmental or agricultural and/or food testing. With a number of laboratories adding this testing yearly, this number is expected to grow exponentially to over 1,000 labs in North America by 2024.
As well as testing for potency, purity, pesticides etc, TDA points out that a number of laboratories are carrying out research and product development. TDA observes that there is no regulated standard for testing, but that there is a need, proven by the fact that at Hempcon 2017, products from different producers were independently tested and were found to be positive for: mold, fungus, bacteria, pesticides and /or harmful solvents.
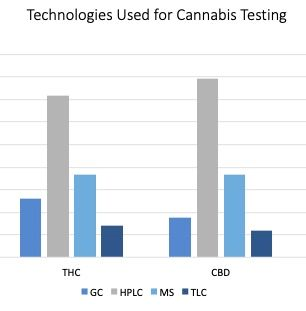 The most common instrumentation used for testing of THC (tetrahydrocannabinol) and CBD (cannabidiol) is HPLC, while pesticides are mostly tested using mass spectrometry, and terpenes and residual solvents by GC.
The average expenditure on cannabis testing products by testing labs is higher than other types of labs (more than government, academia, consumer products, pharma & bio labs) at approximately $200k per lab per year, of which about half goes on instrumentation, and about one-fourth on reagents, chemicals and kits.
A consistent theme throughout the TDA report is the challenge brought by lack of clarity about regulations, and a lack of standardization and harmonization. The report provides a useful summary of technologies used for cannabis testing, as well as a summary of tests requirements by state, according to current legislation. TDA believes that Shimadzu and Agilent are market leaders in terms of current share of cannabis testing market.
The report is available from TDA directly. Contact us to find out how you can buy this full report from TDA, or to discuss how to reach and market your products to the cannabis testing.